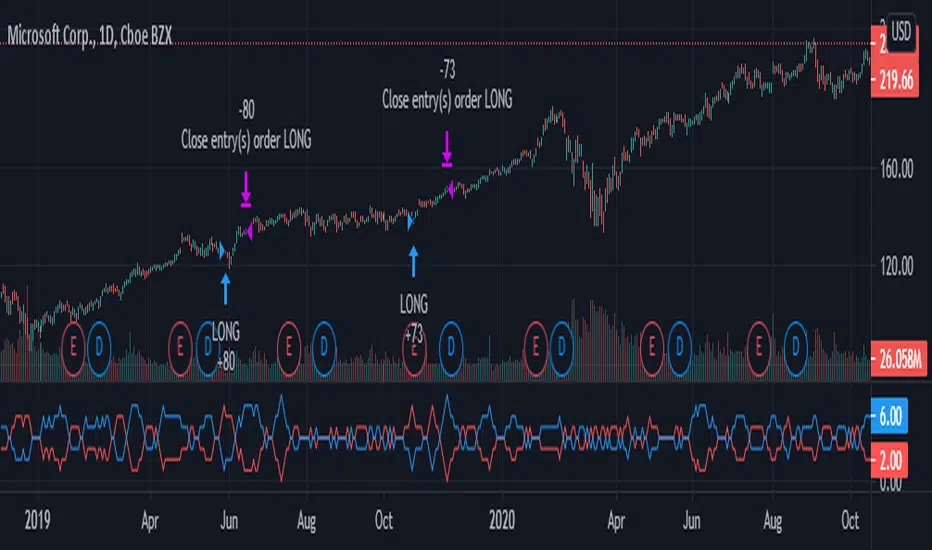
Bearish Bars Uptrend StrategyThe strategy is based on the number of bearish bars or bullish bars of the last 8 bars. Additionally it uses a filter of the moving average of 240 bars.
The idea of the strategy is based on pullbacks in uptrends. The buy signal is given when there are 7 bearish bars of the last 8 bars and the price is above the moving average. The operation is closed when there are 7 bulls of the last 8 bars.
The strategy in the majority of assets has a hit rate of around 60% in daily timefrime. Although since it does not have a stop and the closing signal may not occur even if the asset is going down, there are trades that can be losers with 70% to 80% negative performance. That is why money management is essential to be able to take advantage of the system correctly.
Cari dalam skrip untuk "the strat"
MoneyMoves ALGOThe strategy works with the crossing of two moving averages, slope and basis line of the volatility bands.
when slope crosses up the basis line the signal is buy, when slope crosses down the base line it is sell
the volatility bands represent standard deviations, when the market is flattened it is consolidated
Show Break Out Support or Resistance Alarm
The supports and resistances are based on superior times, daily, weekly, and monthly.
suited has two alarms: one, when the high price breaks resistance or a low price, breaks support. and another when the close with volume breaks resistance or support, select the Volume Break Out S&R Back Period mode, and indicate periods behind the volume.
Back test section.
you can select a specific date for testing the strategy.
You also have the option of a money management, where you can put profits or losses both in buy or sell.
You can also select in the go long or go sell option if you want the system to only operate buy or sell

RSI7 + DCA Long StrategyThe strategy will start new deal when RSI is less than specified value.
The start is not that important though, the real value of this strategy the very flexible DCA settings.

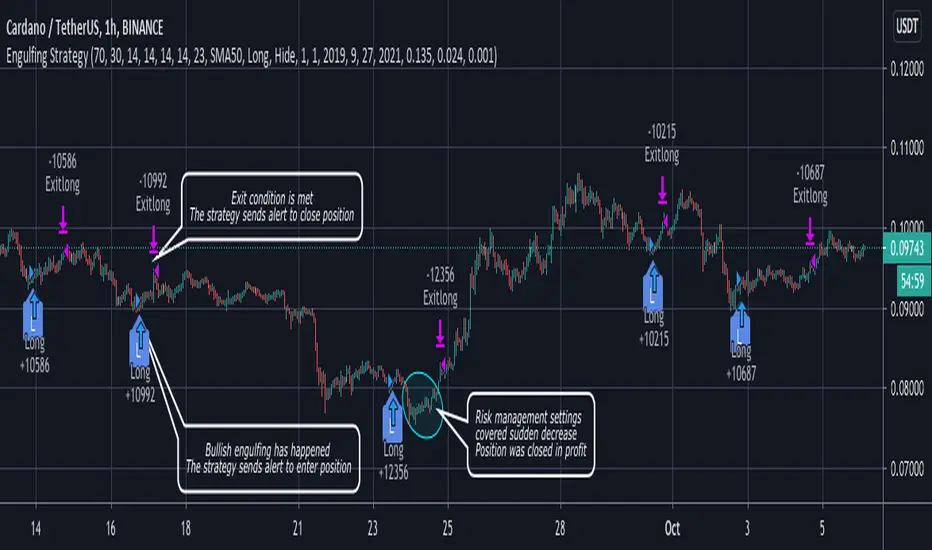
Engulfing strategy with DMI confirmationThe strategy contains Bearish and Bullish Engulfing trend reverse alerts with entry and closure notifications. Entries are enforced by Directional Movement Index (DMI) indicator levels combination. The strategy can be applied to spot, futures and marginal trading exchanges. It is suitable for both long and short positions and works accurately with BTC, USDT, ETH and BNB quote currencies. Best to use with 1H timeframe charts
Strategy elements can be configured at your own desire with user interface settings, no programming skills required:
1. Choose signals type: Long, Short or Both
2. Choose trend detection pattern rule:
SMA50 - provides a higher number of positions
SMA50 + SMA200 provides a higher accuracy
3. Change risk management settings to make the most accurate and efficient configuration. You can set up unique stop loss, take profit and trailing offset for different assets
4. Configure strategy periods
DMI and ADX lengths
ADX Smoothing
Key level
EMA and SMA lengths
5. Configure backtest dates
6. Show or hide RSI support and resistance bands
Engulfing strategy provides information for traders to enter the market in anticipation of a possible reversal in trend. Engulfing candles tend to signal a reversal of the current trend in the market. This specific pattern involves two candles with the latter candle "engulfing" the entire body of the candle before it. The engulfing candle can be bullish or bearish depending on where it forms in relation to the existing trend. The script calculates and compares values of the price action candles to define is there an engulfing and what type it is: bullish or bearish
If there is a bullish engulfing the indicator fills price action candle with yellow color
If there is a bearish engulfing the indicator fills price action candle with purple color
Advantages of the script:
1. The script detects presence of both types of engulfing: Bullish and Bearish
2. Weak engulfment signals and market noises are filtered by RSI bands and DMI confirmations. This allows to receive only strong and confirmed engulfment signals
3. This script has configurable risk management settings (order size, commission, take profit, stop loss and trailing). This provides you opportunity of direct broker connection and allows to conduct backtests before applying the strategy to real account. You also can set up strategy actions alerts
At the chart you can see the historical price action of ADAUSDT at Binance exchange from the January 1st 2019 till current date. The strategy is set up to receive only long signals because it is a spot market. Moments when the strategy triggered to enter a position are shown as L label while position entries are shown as "Long" messages. Moments when a certain position should be closed are shown as "Exitlong" messages
The strategy demonstrate high backtest results:
Mathematical expectation of risk management settings is positive = 1.34%
Percent profitable = 93.33%
Profit factor = 3.253
Quantity of entries = 75
Net profit = 15.22%
How to use?
Long signals:
1. Apply indicator to a trading pair your are interested in.
2. Click Settings button and select Alert Positions Type Long
3. Once bullish engulfing and confirmation conditions are met price action candle will be colored yellow and script strategy will enter a position.
4. Check Strategy Tester to set up optimal Risk management settings: stop loss, trailing profit activation point, trailing offset
5. Set up the strategy alert to be notified when a position should be opened or closed
Short signals:
1. Apply indicator to a trading pair your are interested in.
2. Click Settings button and select Alert Positions Type Short
3. Once bearish engulfing and confirmation conditions are met price action candle will be colored purple and script strategy will enter a position.
4. Check Strategy Tester to set up optimal Risk management settings: stop loss, trailing profit activation point, trailing offset
5. Set up the strategy alert to be notified when a position should be opened or closed
Best regards,
SkyRock Signals team
If you want to receive access to the strategy please contact us in personal message!
The Strategy - Ichimoku Kinko Hyo and moreThe purpose of this strategy is to make the signals from my scripts available for verification by backtests. Different signal and filter combinations can be created and specific manual parameter optimization can be carried out.
In detail, this strategy includes:
23 entry signals
two entry filters with each 9 filters
two exit filters with each 9 filters
take profit and stop loss
time period for backtesting
Trend TradingThe strategy has two scripts coded in it. It uses $10,000 capital, 1 Share is the default quantity, commission of 0.0018.
As you can notice in the AMD chart,
The coded script can do four actions because there are two scripts together.
First script:
A-Buy on red bars
B-sell on green candles.
Second script:
A-buy on red background
B-sell on green background
(This is just to show you the statistics of both scripts).
The way my strategy works is there are multiple weights to gains from certain highs and lows using Fibonacci ratios.
The reason I combined both is I need to know what the trend is to avoid trading against it.
The background color tells me what the trend it.
The bar colors are for entries.
How I filter the signals:
When the background is red, then a down trend. However, my entry would be on green bars.
When the background is green, an uptrend, However, my entry would be on red bars.
The strategy can be used for multiple time frames, please test profitability rate and trade based on your judgment. The indicator is not perfect, and Your skills are important in the decision making. Do not depend solely on the indicator.
Other signals,
1-After a wide green background(uptrend). You could see one a red that could be an entry instead of a downtrend and vice versa.
2-In a wide red background, you could see green bars eventually that could be an overbought condition for a rally and vice versa.
The indicator can help you but will not trade for you. I suggest that you follow the certain conditions I have mentioned (How filter the signals).
If you are interested, please send me private message.

Buy The Dips - MA200 OptimisedThe strategy combines a contrarian approach (buying the dips) with a trend-following logic (only when the price is above the MA200)
The strategy seeks to find the best times when buying the dips on the asset should result to be more profitable.
The price above a long-term moving average indicates momentum that increases the possibility of profiting from buying the asset on short-term weakness.

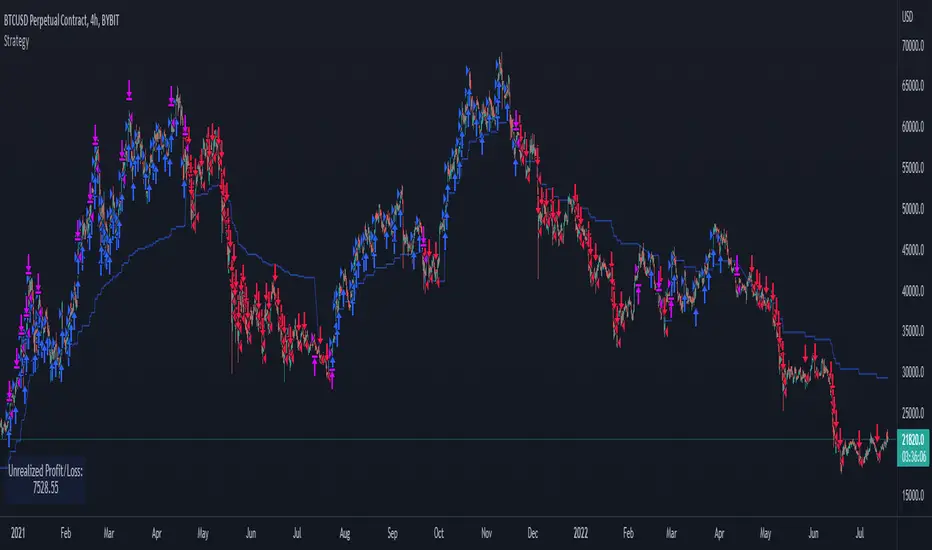
Noro's RiskDonchian StrategyThe strategy uses Donchian price channel . The channel is shown in blue lines. All other lines use Donchian channel too. The red line is the center line between the channel lines. The lime line is a few percent further away. The percentage is set by the user in the strategy settings.
Lines
Blue line - to open position using market stop order
Lime line - take-profit (limit order)
Red line - stop-loss (market stop order, trailing-stop)
For
- BTC /USD, XBT/USD, ETH/USD (need USD)
- timeframe: 1h or 4h

Noro's Donchian StrategyThe strategy uses Donchian price channel . The channel is shown in blue lines. All other lines use Donchian channel too. The red line is the center line between the channel lines. The lime line is a few percent further away. The percentage is set by the user in the strategy settings.
Lines
Blue line - to open position using market stop order
Lime line - take-profit (limit order)
Red line - stop-loss (market stop order, trailing-stop)
For
- BTC /USD, XBT/USD, ETH/USD (need USD)
- timeframe: 1h or 4h

TFs Double Stochastic StrategyThe Strategy script uses Stochastic indicators for entering and exiting a position.
How to use
The strategy works with most timeframes and instruments.
I'm also providing a "study" version of this script, which can be used for automation of the strategy via alerts.
The script is using a default commission of 0.075% which reflects Bitmex' Taker-Fees. This is just a default and can be modified in the strategy settings for each instrument individually.
List of parameters
"Stochastic Length" ... Number of bars for Stochastic indicators
"Stochastic Overbought" ... Stochastic overbought level
"Stochastic Overbought Down Trend" ... Stochastic overbought level for down trends
"Stochastic Oversold Up Trend" ... Stochastic oversold level for up trends
"Stochastic Oversold" ... Stochastic oversold level
"Stochastic Smooth K" ... Stochastic K smoothing
"Stochastic Smooth D" ... Stochastic D smoothing
"MA Filter Enabled" ... Enable an additional filter for entering a position; the entries only follow the overall trend
"Fast Period" ... Fast filter period
"Slow Period" ... Slow filter period
"Backtest ..." ... Backtest timeframe; area outside this timeframe will be grayed out
How to access
This strategy is a "Invite Only" script. Please use the link below or send me a message via Tradingview to obtain access to the strategy and study script.
For enabling the script in your Tradingview chart window, click on "Indicators" and select "Invite-Only Scripts".

BTC Moving Average 15MinThe strategy is based on indicator’s and bar’s closing level analysis on different timeframes.It is responsible for signaling in normal markets (not futures markets).
Features:
- tested (2 years)
- for 15M timeframe
- No repaint
- for BTCUSDT
- With alert script
Along with this strategy, you will also be given a script to provide an alarm at the signal moment.
PM us to obtian access

GOLD SUPER TREND ARROW SIGNALS STRATEGY WITH PERFORMANCEThe strategy is based on combination of ATR, Moving Averages, Volatility indicators that was filtered and final strategy based on accurate arrows that catch trend and
also predict pivot points for intraday Gold ( XAUUSD ) charts.
The strategy script can be used for time frames 30 MIN, 45 MIN, 1Hour, 4 HOURS.
The goal was to create trending strategy with maximum profit and lowest drawdown.
For initial deposit $12000 time frame 30 MIN profit was 42% with maximum drawdown 6%:
For time frame 45 MIN profit was 30% with maximum drawdown 5%:

Noro's TrendMA StrategyThe strategy uses 2 moving averages. Fast and slow. SMA or EMA - the user can select. Moving averages are needed to identify the direction of the trend.
Trend
If both moving averages are directed upwards, it 's uptrend.
If both moving averages are pointing down, it 's downtrend.
If the moving averages are directed in different directions, the trend has not changed.
Background
Lime color is uptrend.
Red color is downtrend.
By default, background display is disabled, but you can enable it in script settings.
Trading
If uptrend (lime background) - open long position (and close short position)
If downtrend (red background) - open short position (and close long position)
Reverse trading, no stop-loss and take-profit
Short positions can be removed and only long positions can be traded.
For
- crypto/USD (XBT/USD, ETH/USD, etc)
- timeframes: 1h, 4h, 1d

Swingtrade strategy for volatile assets on the hourly chartThe strategy of this script is based on a setup that I used in 2016 for swingtrade on PETR4 and other IBOV actions. The intention of this script was to carry out a study to validate the effectiveness of the strategy precisely.
- This strategy works only to operate bought on the 1h (one hour) chart;
- The strategy is based on the strength of the market, which is measured according to moving averages;
- The setup uses targets of 3% above the input signal price and 11.5% stoploss for all operations;
- The stoploss is bigger than the target, this causes the hit rate to be high, but when there is a loss, the damage can be large;
- The setup performed well in some shares of the Brazilian stock market and cryptocurrencies of the dollar pair;

hamster-bot REP strategyThe strategy basically contains RSI + EMA + Parabolic = REP.
Entry: RSI
Trend Filter: EMA
Exit: Trailing Stop Parabolic

TFs I Love Mondays V1The strategy calculates highs and lows of the previous week, and uses them as resistance and support lines. If crossing such resistance/support lines, the strategy enters a long or short position, and exists an open position with predefined profit-targets and a stop-loss.

CryptoTraderX.EMA.RainbowThe strategy is called EMA Rainbow and from a technical point of view it is extremely easy. All this because it uses only one indicator, which is the exponential moving average (EMA). Word “Rainbow”, signals that we will use several different settings of this indicator but don’t worry it is very simple.
The Rainbow EMA strategy uses three exponential moving average EMAs:
6-period moving average (EMA 6)
14-period moving average (EMA 14)
26-period moving average (EMA 26)
long :crossover ema 6 and 26
short: crossunder ema 6 and 26

Hucklekiwi Pip - HLHB Trend-Catcher SystemThe strategy was authored by Hucklekiwi Pip back in 2015 and is still being updated today. She says that the system was designed to simply catch short-term forex trends. At its heart, the system is a simple EMA crossover strategy with a couple of other indicators used for confirming entries.
Strategy Rules
See her original post here:
www.babypips.com
Be sure to check out the updates and tweaks over the years!
HOW TO USE
For full information on how to use this strategy and how to correctly set the exit time, see this post:
backtest-rookies.com

Momentum fader 1.0The strategy is based on a momentum gauge designed for lower timeframes. In the current iteration, trades are very conservative and closed quickly.
In a future version, I've planned to implement dynamic take profit and stoploss levels for ultimate accuracy and maximized profit:drawdown ratio.
The strategy is specifically made for ETH and works best on the 3-minute timeframe.
Enjoy!

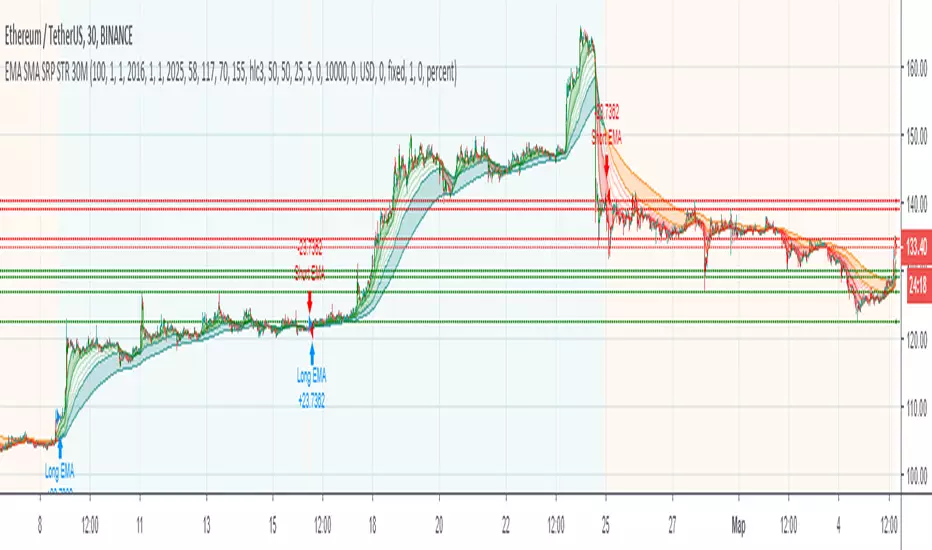
EMA SMA SRP STRATEGY 30MThe strategy is based on indicators:
Exponential Moving Average (EMA)
Simple Moving Average (SMA)
Support and Resistance Levels
Allows to find entry/exit points
Pump/Dump Hunter 15M+ Strategy// The strategy is based on the pumps and dumps, as well as a sudden change in market volumes

Super MFI&STOCH StrategyThe strategy speaks for itself. With it you would have shorted on bitmex with very low average and still be in profit.
Best on the 6hr, 3hr, 2hr, 1hr.

MW+MA Cross StrategyThe strategy uses WMA and SMA indicators with certain algorithm in order to create signals when they cross.
